 Web Server Statistics for [efishon] Web Server Statistics for [efishon]
(Go To: Top: General Summary: Monthly Report: Daily Summary: Hourly Summary: Domain Report: Organisation Report: Host Failure Report: Referrer Report: Referring Site Report: Browser Summary: Operating System Report: Status Code Report: File Size Report: File Type Report: Directory Report: Redirection Report: Failure Report: Request Report)
This report contains overall statistics.
(Figures in parentheses refer to the 7-day period ending 26-Jul-2024 03:39).
Successful requests: 4,717 (845)
Average successful requests per day: 131 (120)
Successful requests for pages: 2,262 (373)
Average successful requests for pages per day: 62 (53)
Failed requests: 1,323 (171)
Redirected requests: 65 (9)
Distinct files requested: 462 (156)
Distinct hosts served: 1,466 (328)
Data transferred: 20.64 megabytes (3.92 megabytes)
Average data transferred per day: 587.48 kilobytes (574.14 kilobytes)
(Go To: Top: General Summary: Monthly Report: Daily Summary: Hourly Summary: Domain Report: Organisation Report: Host Failure Report: Referrer Report: Referring Site Report: Browser Summary: Operating System Report: Status Code Report: File Size Report: File Type Report: Directory Report: Redirection Report: Failure Report: Request Report)
This report lists the activity in each month.
Each unit ( ) represents 40 requests for pages or part thereof.
month: reqs: pages: --------: ----: -----: Jun 2024: 1445: 730:Busiest month: Jul 2024 (1,532 requests for pages).
(Go To: Top: General Summary: Monthly Report: Daily Summary: Hourly Summary: Domain Report: Organisation Report: Host Failure Report: Referrer Report: Referring Site Report: Browser Summary: Operating System Report: Status Code Report: File Size Report: File Type Report: Directory Report: Redirection Report: Failure Report: Request Report)
This report lists the total activity for each day of the week, summed over all the weeks in the report.
Each unit () represents 10 requests for pages or part thereof.
day: reqs: pages: ---: ----: -----: Sun: 614: 276:Mon: 675: 367:

(Go To: Top: General Summary: Monthly Report: Daily Summary: Hourly Summary: Domain Report: Organisation Report: Host Failure Report: Referrer Report: Referring Site Report: Browser Summary: Operating System Report: Status Code Report: File Size Report: File Type Report: Directory Report: Redirection Report: Failure Report: Request Report)
This report lists the total activity for each hour of the day, summed over all the days in the report.
Each unit () represents 5 requests for pages or part thereof.
hour: reqs: pages: ----: ----: -----: 0: 147: 57:11: 252: 103:
21: 205: 93:
(Go To: Top: General Summary: Monthly Report: Daily Summary: Hourly Summary: Domain Report: Organisation Report: Host Failure Report: Referrer Report: Referring Site Report: Browser Summary: Operating System Report: Status Code Report: File Size Report: File Type Report: Directory Report: Redirection Report: Failure Report: Request Report)
This report lists the countries of the computers which requested files.
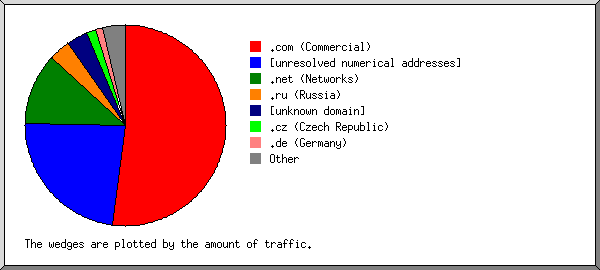
Listing domains, sorted by the amount of traffic.
reqs: %bytes: domain
----: ------: ------
2070: 41.92%: .com (Commercial)
1112: 28.82%: [unresolved numerical addresses]
1149: 21.16%: .ru (Russia)
 120:  3.27%: .net (Networks)
 112:  2.52%: [unknown domain]
  20:  0.68%: .at (Austria)
  39:  0.46%: .de (Germany)
  46:  0.29%: .cz (Czech Republic)
  20:  0.25%: .cn (China)
  11:  0.22%: .org (Non Profit Making Organisations)
   5:  0.11%: .io (British Indian Ocean Territory)
   3:  0.11%: .info (Informational)
   3:  0.10%: .md (Moldova)
   2:  0.02%: .nl (Netherlands)
   2:  0.02%: .th (Thailand)
   1:  0.01%: .ca (Canada)
   1:  0.01%: .bd (Bangladesh)
   1:  0.01%: .ar (Argentina)
(Go To: Top: General Summary: Monthly Report: Daily Summary: Hourly Summary: Domain Report: Organisation Report: Host Failure Report: Referrer Report: Referring Site Report: Browser Summary: Operating System Report: Status Code Report: File Size Report: File Type Report: Directory Report: Redirection Report: Failure Report: Request Report)
This report lists the organisations of the computers which requested files.
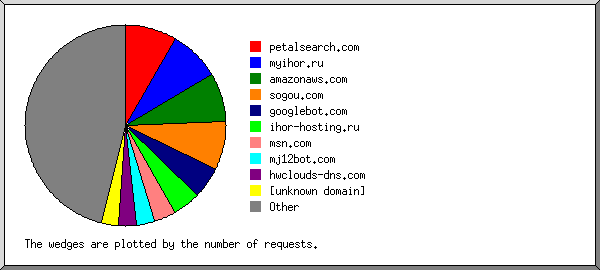
Listing the top 20 organisations by the number of requests, sorted by the number of requests.
reqs: %bytes: organisation
----: ------: ------------
 511: 18.65%: hosted-by-vdsina.ru
 449:  2.20%: googlebot.com
 415: 14.78%: sogou.com
 377:  0.43%: myihor.ru
 374: 14.21%: petalsearch.com
 283:  2.95%: amazonaws.com
 248: 10.97%: 52
 202:  0.23%: ihor-hosting.ru
 112:  2.52%: [unknown domain]
 102:  0.84%: mj12bot.com
 100:  1.23%: 182.43
  72:  0.54%: webmeup.com
  61:  0.45%: ahrefs.com
  57:  1.56%: msn.com
  46:  0.29%: seznam.cz
  42:  0.51%: 106
  41:  0.50%: 119
  39:  0.40%: yandex.com
  38:  1.18%: 46
  37:  0.45%: 43
1111: 25.11%: [not listed: 238 organisations]
(Go To: Top: General Summary: Monthly Report: Daily Summary: Hourly Summary: Domain Report: Organisation Report: Host Failure Report: Referrer Report: Referring Site Report: Browser Summary: Operating System Report: Status Code Report: File Size Report: File Type Report: Directory Report: Redirection Report: Failure Report: Request Report)
This report lists the computers which encountered failed requests.
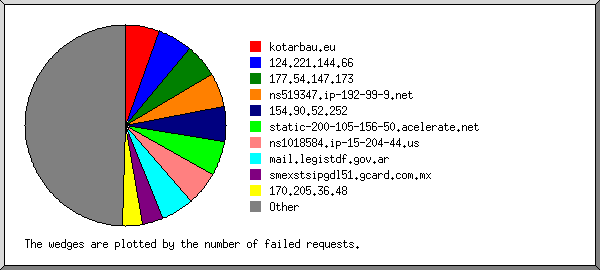
Listing the top 20 hosts by the number of failed requests, sorted by the number of failed requests.
reqs: host
----: ----
 248: 20.57.120.75
  55: 43.248.141.170
  52: 111.229.25.61
  31: nbl216.ntup.net
  24: 77.51.24.139
  23: ninja-crawler83.webmeup.com
  22: ns3085414.ip-145-239-10.eu
  18: 46.148.206.226
  17: srv-141-98-11-180.serveroffer.net
  16: 77.51.29.168
  15: vmi1922378.contaboserver.net
  14: 141.147.177.202
  14: crawl-66-249-66-45.googlebot.com
  14: crawl-66-249-66-32.googlebot.com
  14: crawl-66-249-66-206.googlebot.com
  10: 103.67.163.144
  10: static.76.68.76.144.clients.your-server.de
  10: crawl-66-249-66-33.googlebot.com
   9: 149.28.123.138.vultrusercontent.com
   9: 144.202.105.163.vultrusercontent.com
 698: [not listed: 297 hosts]
(Go To: Top: General Summary: Monthly Report: Daily Summary: Hourly Summary: Domain Report: Organisation Report: Host Failure Report: Referrer Report: Referring Site Report: Browser Summary: Operating System Report: Status Code Report: File Size Report: File Type Report: Directory Report: Redirection Report: Failure Report: Request Report)
This report lists the referrers (where people followed links from, or pages which included this site's images).
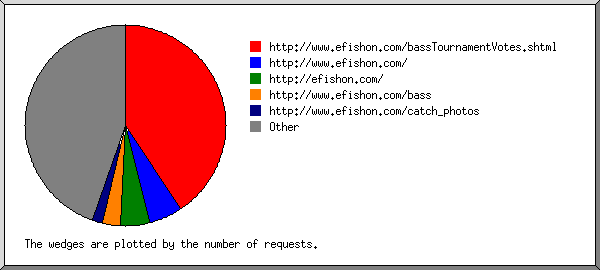
Listing referring URLs with at least 20 requests, sorted by the number of requests.
reqs: URL
----: ---
 946: http://www.efishon.com/bassTournamentVotes.shtml
  16:   http://www.efishon.com/bassTournamentVotes.shtml?poll=000005&=1
  12:   http://www.efishon.com/bassTournamentVotes.shtml?poll=000005&vote=1&commentsname=Crytocorcor&comments=Try+out+the+best+financial+robot+in+the+Internet.+https://t.me/cryptaxbot/11&submit=Vote+Now!
  70: http://efishon.com/
  64: http://www.efishon.com/bass/
  20:   http://www.efishon.com/bass/?C=M%3BO=A
  16:   http://www.efishon.com/bass/?C=N%3BO=D
  12:   http://www.efishon.com/bass/?C=S%3BO=A
  60: http://www.efishon.com/catch_photos/
  11:   http://www.efishon.com/catch_photos/?C=D%3BO%3DA
  57: http://www.efishon.com/
  49: http://www.efishon.com/bass
  38:   http://www.efishon.com/bass?C=M%3BO%3DA
  11:   http://www.efishon.com/bass?C=S%3BO%3DA
  44: https://bradyhorn.com/reports/efishon/
 663: [not listed: 292 URLs]
(Go To: Top: General Summary: Monthly Report: Daily Summary: Hourly Summary: Domain Report: Organisation Report: Host Failure Report: Referrer Report: Referring Site Report: Browser Summary: Operating System Report: Status Code Report: File Size Report: File Type Report: Directory Report: Redirection Report: Failure Report: Request Report)
This report lists which servers people followed links from.
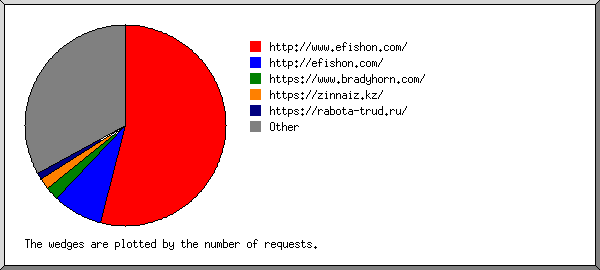
Listing the top 30 referring sites by the number of requests, sorted by the number of requests.
reqs: site
----: ----
1205: http://www.efishon.com/
 102: http://efishon.com/
  44: https://bradyhorn.com/
  13: https://robaz.ru/
  12: http://saverussianretail.ru/
  12: https://sm-glass.ru/
  12: https://vashynogi.com/
  12: https://grandpet.ru/
  11: https://fandbox.ru/
  11: https://doctos.ru/
  11: https://transfer-kurort.ru/
  11: https://gribkovye-zabolevaniya.com/
  11: https://casinos-lucky.com/
  10: https://vilochnie-pogruzchiki-jac.ru/
  10: https://center-job.ru/
   9: https://vilochnyi.ru/
   9: https://casinos-promos.com/
   9: https://floradoc.com/
   9: https://skid-steer.ru/
   9: https://health-post.ru/
   9: https://xn----8sbaa7ddlkj.xn--p1ai/
   8: https://idolstore.net/
   8: https://midler.ru/
   8: https://ls-pan.ru/
   7: https://tigrbusiness.ru/
   7: https://saint-petersburg.novaeco.ru/
   7: https://appmaxx.com/
   7: https://typo1.ru/
   7: https://www.mirar-group.ru/
   7: https://himchistka-shtor-msk.ru/
 346: [not listed: 93 sites]
(Go To: Top: General Summary: Monthly Report: Daily Summary: Hourly Summary: Domain Report: Organisation Report: Host Failure Report: Referrer Report: Referring Site Report: Browser Summary: Operating System Report: Status Code Report: File Size Report: File Type Report: Directory Report: Redirection Report: Failure Report: Request Report)
This report lists the vendors of visitors' browsers.
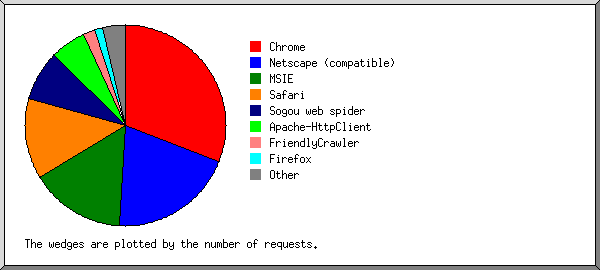
Listing the top 20 browsers by the number of requests, sorted by the number of requests.
reqs: browser
----: -------
1702: Chrome
 194:   Chrome/70
 102:   Chrome/125
 104:   Chrome/121
  45:   Chrome/75
  43:   Chrome/126
 247:   Chrome/120
 159:   Chrome/103
  38:   Chrome/110
 127:   Chrome/114
  69:   Chrome/122
  25:   Chrome/119
  68:   Chrome/116
  62:   Chrome/109
  30:   Chrome/124
  62:   Chrome/117
  27:   Chrome/113
  27:   Chrome/115
  26:   Chrome/118
  21:   Chrome/111
  21:   Chrome/112
1009: Netscape (compatible)
 584: MSIE
   4:   MSIE/8
   1:   MSIE/6
 491: Safari
 363:   Safari/537
  68:   Safari/604
  29:   Safari/600
  26:   Safari/605
   2:   Safari/534
   2:   Safari/602
   1:   Safari/530
 415: Sogou web spider
 415:   Sogou web spider/4
 300: Apache-HttpClient
 300:   Apache-HttpClient/4
  60: Googlebot-Image
  60:   Googlebot-Image/1
  29: Firefox
   5:   Firefox/60
   3:   Firefox/45
   2:   Firefox/83
   2:   Firefox/122
   2:   Firefox/115
   1:   Firefox/35
   1:   Firefox/65
   1:   Firefox/47
   1:   Firefox/48
   1:   Firefox/75
   1:   Firefox/95
   1:   Firefox/0
   1:   Firefox/1
   1:   Firefox/104
   1:   Firefox/123
   1:   Firefox/126
   3:   Firefox/114
   1:   Firefox/79
  17: facebookexternalhit
  17:   facebookexternalhit/1
  17: Expanse, a Palo Alto Networks company, searches across the global IPv4 space multiple times per day to identify customers' presences on the Internet. If you would like to be excluded from our scans, please send IP addresses
  17:   Expanse, a Palo Alto Networks company, searches across the global IPv4 space multiple times per day to identify customers' presences on the Internet. If you would like to be excluded from our scans, please send IP addresses/domains
  11: serpstatbot
  11:   serpstatbot/2
  10: CCBot
  10:   CCBot/2
   9: python-requests
   9:   python-requests/2
   8: panscient.com
   7: Mozilla
   5: curl
   5:   curl/7
   5: Google-Display-Ads-Bot
   4: GlobalWebSearchx
   3: python-httpx
   3:   python-httpx/0
   3: Baiduspider
   3:   Baiduspider/2
  11: [not listed: 6 browsers]
(Go To: Top: General Summary: Monthly Report: Daily Summary: Hourly Summary: Domain Report: Organisation Report: Host Failure Report: Referrer Report: Referring Site Report: Browser Summary: Operating System Report: Status Code Report: File Size Report: File Type Report: Directory Report: Redirection Report: Failure Report: Request Report)
This report lists the operating systems used by visitors.
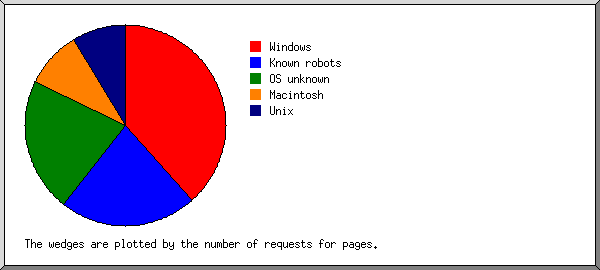
Listing operating systems, sorted by the number of requests for pages.
no.: reqs: pages: OS
---: ----: -----: --
  1: 1792:   774: Windows
   :  708:   604:   Unknown Windows
   :  926:   140:   Windows NT
   :  150:    25:   Windows 7
   :    6:     3:   Windows 8
   :    1:     1:   Windows 2000
   :    1:     1:   Windows XP
  2:  901:   554: Known robots
  3: 1309:   546: OS unknown
  4:  510:   237: Unix
   :  510:   237:   Linux
  5:  188:   138: Macintosh
(Go To: Top: General Summary: Monthly Report: Daily Summary: Hourly Summary: Domain Report: Organisation Report: Host Failure Report: Referrer Report: Referring Site Report: Browser Summary: Operating System Report: Status Code Report: File Size Report: File Type Report: Directory Report: Redirection Report: Failure Report: Request Report)
This report lists the HTTP status codes of all requests.
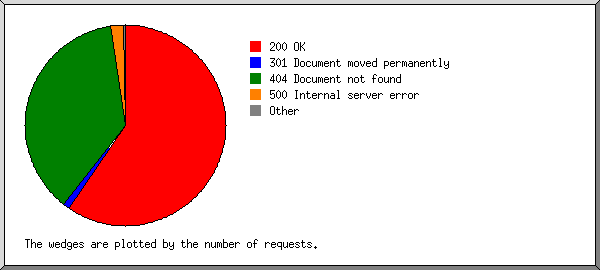
Listing status codes, sorted numerically.
reqs: status code
----: -----------
4616: 200 OK
   1: 206 Partial content
  65: 301 Document moved permanently
 100: 304 Not modified since last retrieval
   1: 403 Access forbidden
1212: 404 Document not found
 110: 500 Internal server error
(Go To: Top: General Summary: Monthly Report: Daily Summary: Hourly Summary: Domain Report: Organisation Report: Host Failure Report: Referrer Report: Referring Site Report: Browser Summary: Operating System Report: Status Code Report: File Size Report: File Type Report: Directory Report: Redirection Report: Failure Report: Request Report)
This report lists the sizes of files.
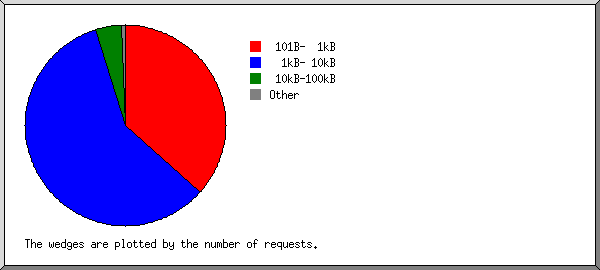
       size: reqs: %bytes:
-----------: ----: ------:
          0:    0:       :
   1B-  10B:    0:       :
  11B- 100B:    0:       :
 101B-  1kB: 1833:  4.20%:
  1kB- 10kB: 2733: 68.04%:
 10kB-100kB:  133: 16.61%:
100kB-  1MB:   18: 11.14%:
(Go To: Top: General Summary: Monthly Report: Daily Summary: Hourly Summary: Domain Report: Organisation Report: Host Failure Report: Referrer Report: Referring Site Report: Browser Summary: Operating System Report: Status Code Report: File Size Report: File Type Report: Directory Report: Redirection Report: Failure Report: Request Report)
This report lists the extensions of files.
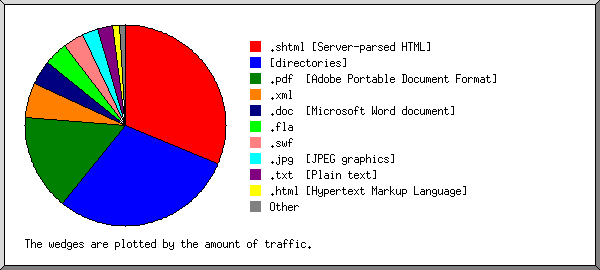
Listing extensions with at least 0.1% of the traffic, sorted by the amount of traffic.
reqs: %bytes: extension
----: ------: ---------
1330: 38.15%: .shtml [Server-parsed HTML]
2094: 29.52%: [directories]
  34: 11.16%: .pdf  [Adobe Portable Document Format]
  67:  5.31%: .jpg  [JPEG graphics]
  32:  4.58%: .doc  [Microsoft Word document]
   8:  2.87%: .fla
  53:  2.33%: .xml
  60:  2.25%: .swf
 673:  2.08%: .txt  [Plain text]
 159:  1.03%: .html [Hypertext Markup Language]
 152:  0.34%: .gif  [GIF graphics]
   8:  0.13%: .gz   [Gzip compressed files]
   8:  0.13%:   .xml.gz
  47:  0.24%: [not listed: 3 extensions]
(Go To: Top: General Summary: Monthly Report: Daily Summary: Hourly Summary: Domain Report: Organisation Report: Host Failure Report: Referrer Report: Referring Site Report: Browser Summary: Operating System Report: Status Code Report: File Size Report: File Type Report: Directory Report: Redirection Report: Failure Report: Request Report)
This report lists the directories from which files were requested. (The figures for each directory include all of its subdirectories.)
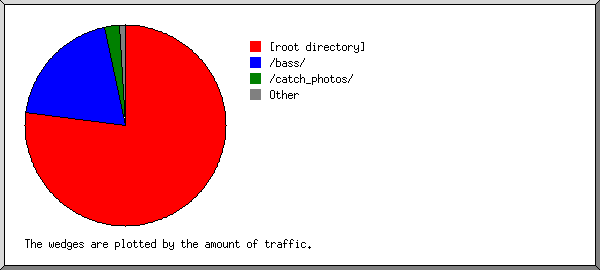
Listing directories with at least 0.01% of the traffic, sorted by the amount of traffic.
reqs: %bytes: directory
----: ------: ---------
4214: 78.33%: [root directory]
 186: 16.09%: /bass/
 156:  4.87%: /catch_photos/
 114:  0.29%: /icons/
  16:  0.22%: /YaBBHelp/
   1:  0.07%: /images/
  19:  0.06%: /css/
   1:  0.04%: http://
  10:  0.02%: /img/
(Go To: Top: General Summary: Monthly Report: Daily Summary: Hourly Summary: Domain Report: Organisation Report: Host Failure Report: Referrer Report: Referring Site Report: Browser Summary: Operating System Report: Status Code Report: File Size Report: File Type Report: Directory Report: Redirection Report: Failure Report: Request Report)
This report lists the files that caused requests to be redirected to another file. (Usually directories with the final slash missing, or CGI scripts that forced redirections.)
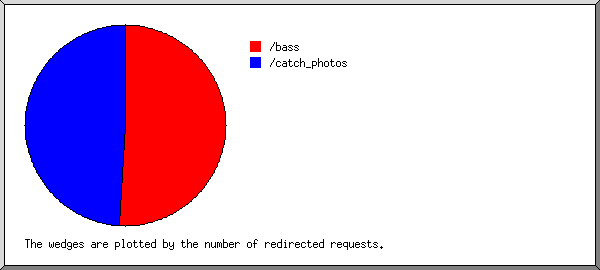
Listing files, sorted by the number of redirected requests.
reqs: file
----: ----
  39: /bass
  26: /catch_photos
(Go To: Top: General Summary: Monthly Report: Daily Summary: Hourly Summary: Domain Report: Organisation Report: Host Failure Report: Referrer Report: Referring Site Report: Browser Summary: Operating System Report: Status Code Report: File Size Report: File Type Report: Directory Report: Redirection Report: Failure Report: Request Report)
This report lists the files that caused failures, for example files not found.
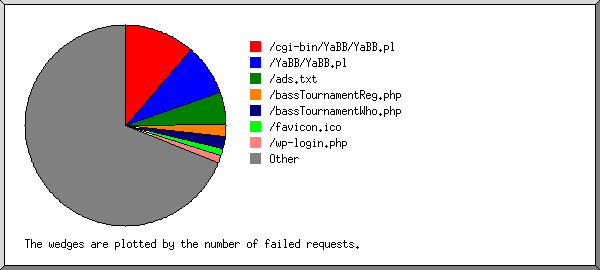
Listing the top 30 files by the number of failed requests, sorted by the number of failed requests.
reqs: file
----: ----
 183: /cgi-bin/YaBB/YaBB.pl
 126: /YaBB/YaBB.pl
  95: /ads.txt
  44: /bassTournamentReg.php
  42: /bassTournamentWho.php
  29: /favicon.ico
  29: /wp-login.php
  18: /.env
  17: /old
  17: /new
  17: /wordpress
  17: /wp
  17: /home
  16: /backup
  16: /bc
  16: /bk
  16: /main
  11: /bassTournamentWho1.php
  11: /bassTournamentWho2.php
   8: /index.php
   4: /sitemap.txt
   3: /api/.env
   3: /sftp-config.json
   3: /wp-json/litespeed/v1/cdn_status
   3: /.well-known/security.txt
   3: /prod/.env
   3: /.vscode/sftp.json
   3: /php-cgi/php-cgi.exe
   2: /downloads/.env
   2: /extensions/.env
 549: [not listed: 406 files]
(Go To: Top: General Summary: Monthly Report: Daily Summary: Hourly Summary: Domain Report: Organisation Report: Host Failure Report: Referrer Report: Referring Site Report: Browser Summary: Operating System Report: Status Code Report: File Size Report: File Type Report: Directory Report: Redirection Report: Failure Report: Request Report)
This report lists the files on the site.
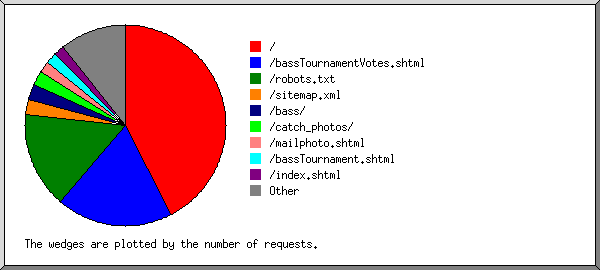
Listing files with at least 20 requests, sorted by the number of requests.
reqs: %bytes:       last time: file
----: ------: ---------------: ----
1869: 28.86%: 25/Jul/24 23:02: /
  15:  0.18%: 22/Jul/24 20:16:   /?author=1
  15:  0.18%: 22/Jul/24 20:16:   /?author=2
  15:  0.18%: 22/Jul/24 20:16:   /?author=3
  15:  0.18%: 22/Jul/24 20:16:   /?author=4
  15:  0.18%: 22/Jul/24 20:16:   /?author=5
  15:  0.18%: 22/Jul/24 20:16:   /?author=6
  15:  0.18%: 22/Jul/24 20:16:   /?author=7
  15:  0.18%: 22/Jul/24 20:16:   /?author=8
  15:  0.18%: 22/Jul/24 20:16:   /?author=9
  15:  0.18%: 22/Jul/24 20:16:   /?author=10
  15:  0.18%: 22/Jul/24 20:17:   /?author=20
  15:  0.18%: 22/Jul/24 20:16:   /?author=11
  15:  0.18%: 22/Jul/24 20:16:   /?author=12
  15:  0.18%: 22/Jul/24 20:16:   /?author=13
  15:  0.18%: 22/Jul/24 20:16:   /?author=14
  15:  0.18%: 22/Jul/24 20:17:   /?author=15
  15:  0.18%: 22/Jul/24 20:17:   /?author=16
  15:  0.18%: 22/Jul/24 20:17:   /?author=17
  15:  0.18%: 22/Jul/24 20:17:   /?author=18
  15:  0.18%: 22/Jul/24 20:17:   /?author=19
1045: 34.87%: 25/Jul/24 23:17: /bassTournamentVotes.shtml
  17:  0.25%: 21/Jul/24 04:30:   /bassTournamentVotes.shtml?poll=000005&viewcomments=1
  16:  0.27%: 23/Jul/24 19:31:   /bassTournamentVotes.shtml?poll=000005&viewresults=1
  15:  0.38%: 11/Jul/24 17:33:   /bassTournamentVotes.shtml?poll=000005&vote=1&commentsname=Crytocorcor&comments=Try+out+the+best+financial+robot+in+the+Internet.+https://t.me/cryptaxbot/11&submit=Vote+Now!
 673:  2.08%: 25/Jul/24 23:28: /robots.txt
 120:  0.34%: 25/Jul/24 22:55: /bass/
  14:  0.04%: 24/Jul/24 03:49:   /bass/?C=M%3BO%3DA
  12:  0.03%: 25/Jul/24 22:55:   /bass/?C=N%3BO%3DD
  11:  0.03%: 22/Jul/24 02:25:   /bass/?C=S%3BO%3DA
 105:  0.32%: 25/Jul/24 11:48: /catch_photos/
  12:  0.04%: 23/Jul/24 03:39:   /catch_photos/?C=D%3BO%3DA
  12:  0.04%: 25/Jul/24 09:14:   /catch_photos/?C=M%3BO%3DA
  10:  0.03%: 19/Jul/24 04:00:   /catch_photos/?C=N%3BO%3DD
  10:  0.03%: 22/Jul/24 20:46:   /catch_photos/?C=S%3BO%3DA
  96:  1.09%: 25/Jul/24 01:07: /mailphoto.shtml
  88:  0.99%: 25/Jul/24 01:06: /bassTournament.shtml
  72:  1.05%: 25/Jul/24 01:57: /index.shtml
  46:  2.32%: 25/Jul/24 06:53: /sitemap.xml
  38:  2.01%: 25/Jul/24 11:18: /catch_photos/20030129Salmon.jpg
  34: 11.16%: 24/Jul/24 22:03: /bass/efishontournament.pdf
  31:  0.07%: 17/Jul/24 12:54: /icons/blank.gif
  31:  0.08%: 17/Jul/24 12:54: /icons/back.gif
  28:  0.04%: 24/Jul/24 19:01: /web_logo.gif
  22:  2.82%: 25/Jul/24 17:48: /bass/efishontournament.doc
  21:  0.19%: 21/Jul/24 12:11: /index2.html
  20:  0.09%: 23/Jul/24 13:25: /index1.html
 378: 11.63%: 25/Jul/24 06:46: [not listed: 50 files]
(Go To: Top: General Summary: Monthly Report: Daily Summary: Hourly Summary: Domain Report: Organisation Report: Host Failure Report: Referrer Report: Referring Site Report: Browser Summary: Operating System Report: Status Code Report: File Size Report: File Type Report: Directory Report: Redirection Report: Failure Report: Request Report)

