 Web Server Statistics for [Zachary A Horn dot Com] Web Server Statistics for [Zachary A Horn dot Com]
(Go To: Top: General Summary: Monthly Report: Daily Summary: Hourly Summary: Domain Report: Organisation Report: Host Failure Report: Referrer Report: Referring Site Report: Browser Summary: Operating System Report: Status Code Report: File Size Report: File Type Report: Directory Report: Failure Report: Request Report)
This report contains overall statistics.
(Figures in parentheses refer to the 7-day period ending 26-Jul-2024 03:39).
Successful requests: 1,442 (249)
Average successful requests per day: 40 (35)
Successful requests for pages: 503 (88)
Average successful requests for pages per day: 13 (12)
Failed requests: 634 (56)
Distinct files requested: 58 (12)
Distinct hosts served: 722 (185)
Data transferred: 4.02 megabytes (423.35 kilobytes)
Average data transferred per day: 114.42 kilobytes (60.48 kilobytes)
(Go To: Top: General Summary: Monthly Report: Daily Summary: Hourly Summary: Domain Report: Organisation Report: Host Failure Report: Referrer Report: Referring Site Report: Browser Summary: Operating System Report: Status Code Report: File Size Report: File Type Report: Directory Report: Failure Report: Request Report)
This report lists the activity in each month.
Each unit ( ) represents 10 requests for pages or part thereof.
month: reqs: pages: --------: ----: -----: Jun 2024: 462: 147:Busiest month: Jul 2024 (356 requests for pages).
(Go To: Top: General Summary: Monthly Report: Daily Summary: Hourly Summary: Domain Report: Organisation Report: Host Failure Report: Referrer Report: Referring Site Report: Browser Summary: Operating System Report: Status Code Report: File Size Report: File Type Report: Directory Report: Failure Report: Request Report)
This report lists the total activity for each day of the week, summed over all the weeks in the report.
Each unit () represents 2 requests for pages or part thereof.
day: reqs: pages: ---: ----: -----: Sun: 189: 67:Mon: 226: 80:
Tue: 171: 62:
(Go To: Top: General Summary: Monthly Report: Daily Summary: Hourly Summary: Domain Report: Organisation Report: Host Failure Report: Referrer Report: Referring Site Report: Browser Summary: Operating System Report: Status Code Report: File Size Report: File Type Report: Directory Report: Failure Report: Request Report)
This report lists the total activity for each hour of the day, summed over all the days in the report.
Each unit () represents 1 request for a page.
hour: reqs: pages: ----: ----: -----: 0: 50: 15:2: 52: 18:
(Go To: Top: General Summary: Monthly Report: Daily Summary: Hourly Summary: Domain Report: Organisation Report: Host Failure Report: Referrer Report: Referring Site Report: Browser Summary: Operating System Report: Status Code Report: File Size Report: File Type Report: Directory Report: Failure Report: Request Report)
This report lists the countries of the computers which requested files.
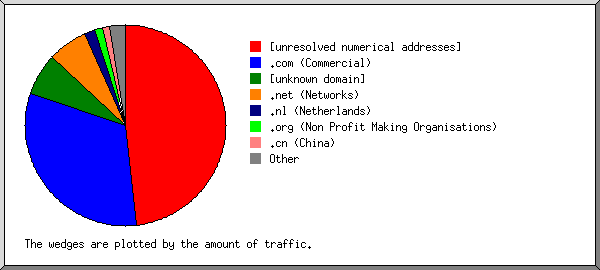
Listing domains, sorted by the amount of traffic.
reqs: %bytes: domain
----: ------: ------
  72: 43.03%: .de (Germany)
 406: 27.82%: [unresolved numerical addresses]
 790: 20.67%: .com (Commercial)
  46:  3.98%: [unknown domain]
  55:  1.60%: .org (Non Profit Making Organisations)
  32:  1.47%: .net (Networks)
   6:  0.57%: .nl (Netherlands)
  19:  0.30%: .cz (Czech Republic)
   7:  0.18%: .cn (China)
   3:  0.14%: .ru (Russia)
   3:  0.08%: .ca (Canada)
   1:  0.08%: .info (Informational)
   1:  0.03%: .it (Italy)
   1:  0.03%: .io (British Indian Ocean Territory)
(Go To: Top: General Summary: Monthly Report: Daily Summary: Hourly Summary: Domain Report: Organisation Report: Host Failure Report: Referrer Report: Referring Site Report: Browser Summary: Operating System Report: Status Code Report: File Size Report: File Type Report: Directory Report: Failure Report: Request Report)
This report lists the organisations of the computers which requested files.
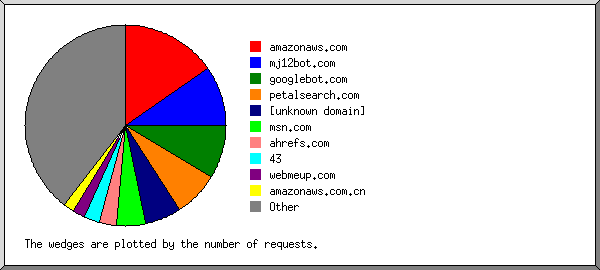
Listing the top 20 organisations by the number of requests, sorted by the number of requests.
reqs: %bytes: organisation
----: ------: ------------
 260:  5.06%: googlebot.com
 114:  2.56%: mj12bot.com
 108:  2.26%: petalsearch.com
 104:  2.65%: amazonaws.com
  76:  1.44%: 52
  67: 42.88%: your-server.de
  61:  1.35%: ahrefs.com
  46:  3.98%: [unknown domain]
  46:  1.29%: 1and1.org
  41:  1.26%: msn.com
  33:  1.00%: 43
  27:  0.35%: 223.72
  25:  0.32%: 120
  25:  0.62%: webmeup.com
  19:  0.30%: seznam.cz
  19:  0.67%: 216.244
  16:  0.28%: apple.com
  14:  0.42%: fbsv.net
  10:  0.76%: 205.210
  10:  0.24%: 27
 321: 30.28%: [not listed: 130 organisations]
(Go To: Top: General Summary: Monthly Report: Daily Summary: Hourly Summary: Domain Report: Organisation Report: Host Failure Report: Referrer Report: Referring Site Report: Browser Summary: Operating System Report: Status Code Report: File Size Report: File Type Report: Directory Report: Failure Report: Request Report)
This report lists the computers which encountered failed requests.
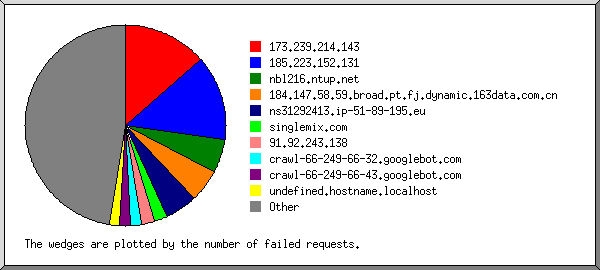
Listing the top 20 hosts by the number of failed requests, sorted by the number of failed requests.
reqs: host
----: ----
 248: 20.1.166.197
  36: nbl216.ntup.net
  19: srv-141-98-11-180.serveroffer.net
  16: ns3085414.ip-145-239-10.eu
  14: crawl-66-249-66-37.googlebot.com
  12: vmi1922378.contaboserver.net
   9: 45.63.22.52.vultrusercontent.com
   9: 207.246.80.141.vultrusercontent.com
   9: 45.76.229.108.vultrusercontent.com
   9: 144.202.113.216.vultrusercontent.com
   9: 66.135.2.200.vultrusercontent.com
   9: crawl-66-249-66-44.googlebot.com
   9: 161.35.134.8
   9: 45-33-26-89.ip.linodeusercontent.com
   9: 138.197.22.254
   9: 45.63.106.135.vultrusercontent.com
   9: 45.77.151.152.vultrusercontent.com
   9: ns31292413.ip-51-89-195.eu
   9: 143.198.2.148
   8: crawl-66-249-66-43.googlebot.com
 164: [not listed: 104 hosts]
(Go To: Top: General Summary: Monthly Report: Daily Summary: Hourly Summary: Domain Report: Organisation Report: Host Failure Report: Referrer Report: Referring Site Report: Browser Summary: Operating System Report: Status Code Report: File Size Report: File Type Report: Directory Report: Failure Report: Request Report)
This report lists the referrers (where people followed links from, or pages which included this site's images).
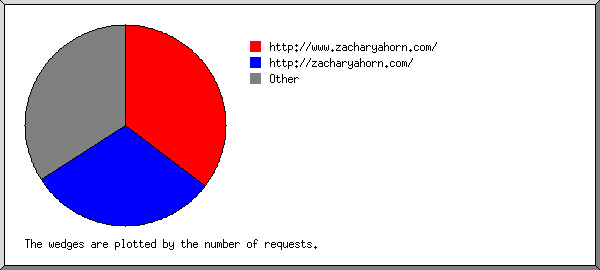
Listing referring URLs with at least 20 requests, sorted by the number of requests.
reqs: URL
----: ---
  50: http://www.zacharyahorn.com/
  49: http://zacharyahorn.com/
  30: http://zacharyahorn.com/album01.shtml
  27: http://zacharyahorn.com/album02.shtml
  43: [not listed: 11 URLs]
(Go To: Top: General Summary: Monthly Report: Daily Summary: Hourly Summary: Domain Report: Organisation Report: Host Failure Report: Referrer Report: Referring Site Report: Browser Summary: Operating System Report: Status Code Report: File Size Report: File Type Report: Directory Report: Failure Report: Request Report)
This report lists which servers people followed links from.
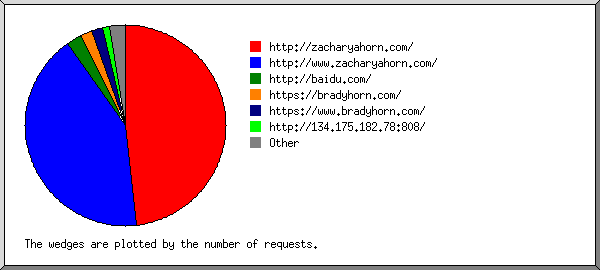
Listing referring sites, sorted by the number of requests.
reqs: site
----: ----
 119: http://zacharyahorn.com/
  65: http://www.zacharyahorn.com/
   8: https://www.bradyhorn.com/
   3: https://www.google.com/
   2: https://google.com/
   1: http://www.sestarblog.shop/
   1: http://baidu.com/
(Go To: Top: General Summary: Monthly Report: Daily Summary: Hourly Summary: Domain Report: Organisation Report: Host Failure Report: Referrer Report: Referring Site Report: Browser Summary: Operating System Report: Status Code Report: File Size Report: File Type Report: Directory Report: Failure Report: Request Report)
This report lists the vendors of visitors' browsers.
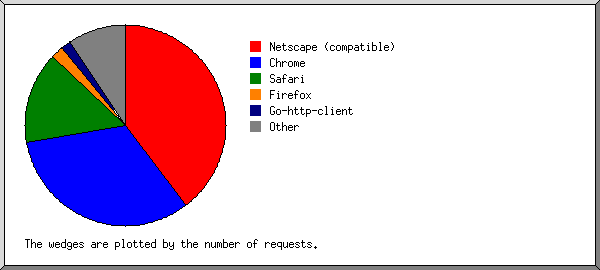
Listing the top 20 browsers by the number of requests, sorted by the number of requests.
reqs: browser
----: -------
 603: Netscape (compatible)
 433: Chrome
 118:   Chrome/125
  35:   Chrome/50
  24:   Chrome/121
  16:   Chrome/74
  14:   Chrome/100
  19:   Chrome/126
  10:   Chrome/122
   6:   Chrome/66
   7:   Chrome/60
   4:   Chrome/120
   4:   Chrome/81
   9:   Chrome/124
   5:   Chrome/114
   4:   Chrome/105
  41:   Chrome/116
  17:   Chrome/70
   8:   Chrome/87
   4:   Chrome/51
   4:   Chrome/61
   4:   Chrome/55
 209: Safari
  76:   Safari/604
  96:   Safari/537
  19:   Safari/605
  10:   Safari/600
   2:   Safari/602
   4:   Safari/533
   1:   Safari/531
   1:   Safari/534
  46: IonCrawl (https:
  46:   IonCrawl (https://www
  36: Firefox
   7:   Firefox/3
   6:   Firefox/123
   2:   Firefox/115
   2:   Firefox/126
   4:   Firefox/114
   1:   Firefox/35
   1:   Firefox/81
   1:   Firefox/56
   1:   Firefox/58
   1:   Firefox/89
   1:   Firefox/122
   1:   Firefox/117
   6:   Firefox/72
   2:   Firefox/121
  15: facebookexternalhit
  15:   facebookexternalhit/1
  12: CCBot
  12:   CCBot/2
  12: Expanse, a Palo Alto Networks company, searches across the global IPv4 space multiple times per day to identify customers' presences on the Internet. If you would like to be excluded from our scans, please send IP addresses
  12:   Expanse, a Palo Alto Networks company, searches across the global IPv4 space multiple times per day to identify customers' presences on the Internet. If you would like to be excluded from our scans, please send IP addresses/domains
  11: serpstatbot
  11:   serpstatbot/2
  10: Go-http-client
  10:   Go-http-client/1
   8: panscient.com
   6: Baiduspider
   3:   Baiduspider/2
   5: GlobalWebSearchx
   3: python-requests
   3:   python-requests/2
   3: curl
   3:   curl/7
   2: GuzzleHttp
   2:   GuzzleHttp/7
   2: mozilla
   2:   mozilla/5
   2: Mozilla
   1:   Mozilla/1
   2: Pandalytics
   2:   Pandalytics/2
   2: PycURL
   2:   PycURL/7
   5: [not listed: 5 browsers]
(Go To: Top: General Summary: Monthly Report: Daily Summary: Hourly Summary: Domain Report: Organisation Report: Host Failure Report: Referrer Report: Referring Site Report: Browser Summary: Operating System Report: Status Code Report: File Size Report: File Type Report: Directory Report: Failure Report: Request Report)
This report lists the operating systems used by visitors.
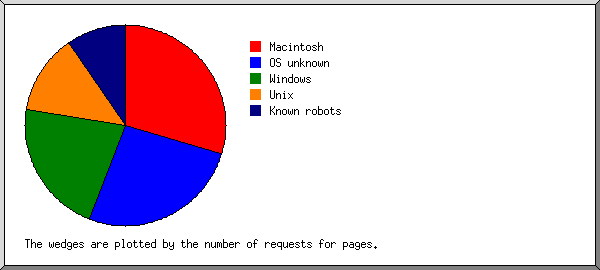
Listing operating systems, sorted by the number of requests for pages.
no.: reqs: pages: OS
---: ----: -----: --
  1:  650:   140: OS unknown
  2:  159:   121: Macintosh
  3:  186:   100: Windows
   :  144:    68:   Windows NT
   :   34:    24:   Windows 7
   :    4:     4:   Windows XP
   :    4:     4:   Unknown Windows
  4:  215:    84: Unix
   :  215:    84:   Linux
  5:  217:    43: Known robots
(Go To: Top: General Summary: Monthly Report: Daily Summary: Hourly Summary: Domain Report: Organisation Report: Host Failure Report: Referrer Report: Referring Site Report: Browser Summary: Operating System Report: Status Code Report: File Size Report: File Type Report: Directory Report: Failure Report: Request Report)
This report lists the HTTP status codes of all requests.
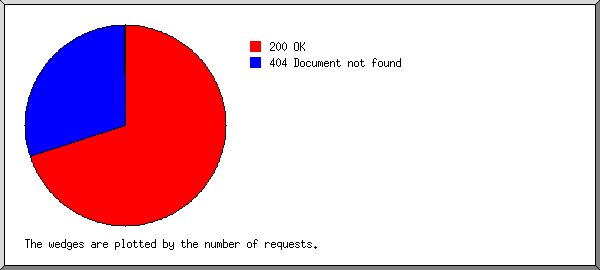
Listing status codes, sorted numerically.
reqs: status code
----: -----------
1440: 200 OK
   2: 304 Not modified since last retrieval
 634: 404 Document not found
(Go To: Top: General Summary: Monthly Report: Daily Summary: Hourly Summary: Domain Report: Organisation Report: Host Failure Report: Referrer Report: Referring Site Report: Browser Summary: Operating System Report: Status Code Report: File Size Report: File Type Report: Directory Report: Failure Report: Request Report)
This report lists the sizes of files.
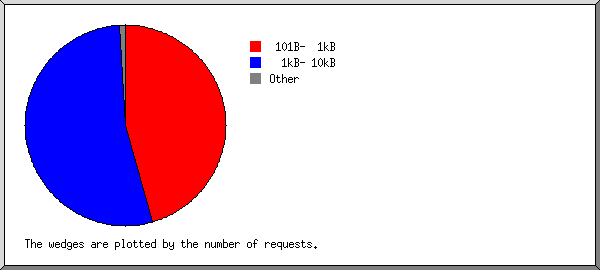
       size: reqs: %bytes:
-----------: ----: ------:
          0:    0:       :
   1B-  10B:    0:       :
  11B- 100B:    0:       :
 101B-  1kB:  697:  9.42%:
  1kB- 10kB:  684: 26.92%:
 10kB-100kB:   54: 44.55%:
100kB-  1MB:    7: 19.11%:
(Go To: Top: General Summary: Monthly Report: Daily Summary: Hourly Summary: Domain Report: Organisation Report: Host Failure Report: Referrer Report: Referring Site Report: Browser Summary: Operating System Report: Status Code Report: File Size Report: File Type Report: Directory Report: Failure Report: Request Report)
This report lists the extensions of files.
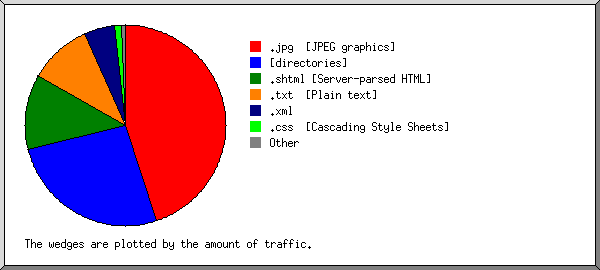
Listing extensions with at least 0.1% of the traffic, sorted by the amount of traffic.
reqs: %bytes: extension
----: ------: ---------
  61: 63.66%: .jpg  [JPEG graphics]
 478: 17.58%: [directories]
 596:  8.09%: .txt  [Plain text]
 155:  6.55%: .shtml [Server-parsed HTML]
  75:  2.94%: .xml
  52:  0.87%: .css  [Cascading Style Sheets]
  25:  0.31%: .html [Hypertext Markup Language]
(Go To: Top: General Summary: Monthly Report: Daily Summary: Hourly Summary: Domain Report: Organisation Report: Host Failure Report: Referrer Report: Referring Site Report: Browser Summary: Operating System Report: Status Code Report: File Size Report: File Type Report: Directory Report: Failure Report: Request Report)
This report lists the directories from which files were requested. (The figures for each directory include all of its subdirectories.)

Listing directories with at least 0.01% of the traffic, sorted by the amount of traffic.
reqs: %bytes: directory
----: ------: ---------
  61: 63.66%: /images/
1381: 36.34%: [root directory]
(Go To: Top: General Summary: Monthly Report: Daily Summary: Hourly Summary: Domain Report: Organisation Report: Host Failure Report: Referrer Report: Referring Site Report: Browser Summary: Operating System Report: Status Code Report: File Size Report: File Type Report: Directory Report: Failure Report: Request Report)
This report lists the files that caused failures, for example files not found.
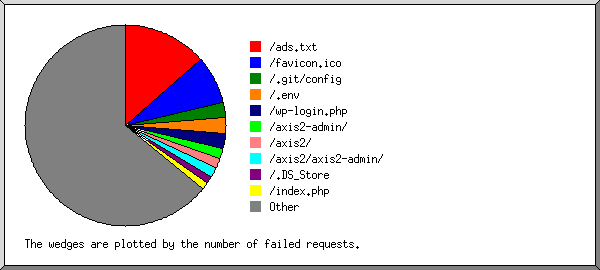
Listing the top 30 files by the number of failed requests, sorted by the number of failed requests.
reqs: file
----: ----
  74: /ads.txt
  21: /favicon.ico
  12: /old
  12: /wp-login.php
  12: /new
  12: /wordpress
  12: /wp
  12: /home
  11: /backup
  11: /bc
  11: /bk
  11: /.git/config
  11: /.env
  11: /main
   4: /index.php
   4: /.DS_Store
   3: /api/.env
   3: /admin/.env
   3: /laravel/.env
   3: /noexist_245716fe12ab3ef2.html
   3: /googlef8fca7e472aaadfa.html
   2: /downloads/.env
   2: /extensions/.env
   2: /tools/.env
   2: /en/.env
   2: /sites/all/modules/elfinder/src/connectors/php/connector.php
   2: /inc/.env
   2: /webroot/.env
   2: /home/.env
   2: /framework/.env
 360: [not listed: 240 files]
(Go To: Top: General Summary: Monthly Report: Daily Summary: Hourly Summary: Domain Report: Organisation Report: Host Failure Report: Referrer Report: Referring Site Report: Browser Summary: Operating System Report: Status Code Report: File Size Report: File Type Report: Directory Report: Failure Report: Request Report)
This report lists the files on the site.
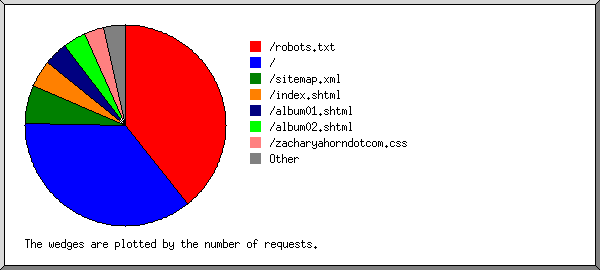
Listing files with at least 20 requests, sorted by the number of requests.
reqs: %bytes:       last time: file
----: ------: ---------------: ----
 596:  8.09%: 25/Jul/24 23:42: /robots.txt
 478: 17.58%: 25/Jul/24 22:12: /
  69:  2.88%: 25/Jul/24 19:54: /sitemap.xml
  54:  2.44%: 24/Jul/24 04:07: /album02.shtml
  53:  1.87%: 24/Jul/24 20:45: /index.shtml
  52:  0.87%: 25/Jul/24 18:14: /zacharyahorndotcom.css
  48:  2.24%: 23/Jul/24 15:13: /album01.shtml
  92: 64.03%: 25/Jul/24 23:42: [not listed: 50 files]
(Go To: Top: General Summary: Monthly Report: Daily Summary: Hourly Summary: Domain Report: Organisation Report: Host Failure Report: Referrer Report: Referring Site Report: Browser Summary: Operating System Report: Status Code Report: File Size Report: File Type Report: Directory Report: Failure Report: Request Report)

