 Web Server Statistics for [Max Horn dot Com] Web Server Statistics for [Max Horn dot Com]
(Go To: Top: General Summary: Monthly Report: Daily Summary: Hourly Summary: Domain Report: Organisation Report: Host Failure Report: Referrer Report: Referring Site Report: Browser Summary: Operating System Report: Status Code Report: File Size Report: File Type Report: Directory Report: Failure Report: Request Report)
This report contains overall statistics.
(Figures in parentheses refer to the 7-day period ending 18-Jul-2025 03:39).
Successful requests: 2,670 (583)
Average successful requests per day: 74 (83)
Successful requests for pages: 1,360 (273)
Average successful requests for pages per day: 37 (38)
Failed requests: 7,321 (3,891)
Distinct files requested: 107 (13)
Distinct hosts served: 1,086 (308)
Data transferred: 6.35 megabytes (959.14 kilobytes)
Average data transferred per day: 180.63 kilobytes (137.02 kilobytes)
(Go To: Top: General Summary: Monthly Report: Daily Summary: Hourly Summary: Domain Report: Organisation Report: Host Failure Report: Referrer Report: Referring Site Report: Browser Summary: Operating System Report: Status Code Report: File Size Report: File Type Report: Directory Report: Failure Report: Request Report)
This report lists the activity in each month.
Each unit ( ) represents 20 requests for pages or part thereof.
month: reqs: pages: --------: ----: -----: Jun 2025: 1258: 726:Busiest month: Jun 2025 (726 requests for pages).
(Go To: Top: General Summary: Monthly Report: Daily Summary: Hourly Summary: Domain Report: Organisation Report: Host Failure Report: Referrer Report: Referring Site Report: Browser Summary: Operating System Report: Status Code Report: File Size Report: File Type Report: Directory Report: Failure Report: Request Report)
This report lists the total activity for each day of the week, summed over all the weeks in the report.
Each unit () represents 6 requests for pages or part thereof.
day: reqs: pages: ---: ----: -----: Sun: 352: 184:Fri: 373: 211:
Sat: 350: 169:
(Go To: Top: General Summary: Monthly Report: Daily Summary: Hourly Summary: Domain Report: Organisation Report: Host Failure Report: Referrer Report: Referring Site Report: Browser Summary: Operating System Report: Status Code Report: File Size Report: File Type Report: Directory Report: Failure Report: Request Report)
This report lists the total activity for each hour of the day, summed over all the days in the report.
Each unit () represents 2 requests for pages or part thereof.
hour: reqs: pages: ----: ----: -----: 0: 80: 38:3: 103: 56:
(Go To: Top: General Summary: Monthly Report: Daily Summary: Hourly Summary: Domain Report: Organisation Report: Host Failure Report: Referrer Report: Referring Site Report: Browser Summary: Operating System Report: Status Code Report: File Size Report: File Type Report: Directory Report: Failure Report: Request Report)
This report lists the countries of the computers which requested files.
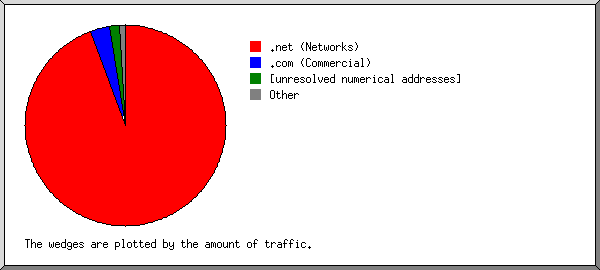
Listing domains, sorted by the amount of traffic.
reqs: %bytes: domain
----: ------: ------
1426: 81.02%: [unresolved numerical addresses]
 324:  9.05%: .net (Networks)
 779:  8.60%: .com (Commercial)
  74:  0.61%: [unknown domain]
  17:  0.22%: .cz (Czech Republic)
  20:  0.20%: .org (Non Profit Making Organisations)
  10:  0.08%: .de (Germany)
   3:  0.07%: .io (British Indian Ocean Territory)
   7:  0.06%: .cn (China)
   4:  0.03%: .nl (Netherlands)
   1:  0.01%: .ru (Russia)
   1:  0.01%: .lt (Lithuania)
   1:  0.01%: .se (Sweden)
   1:  0.01%: .arpa (Arpanet)
   1:  0.01%: .sh (Saint Helena)
   1:  0.01%: .pl (Poland)
(Go To: Top: General Summary: Monthly Report: Daily Summary: Hourly Summary: Domain Report: Organisation Report: Host Failure Report: Referrer Report: Referring Site Report: Browser Summary: Operating System Report: Status Code Report: File Size Report: File Type Report: Directory Report: Failure Report: Request Report)
This report lists the organisations of the computers which requested files.
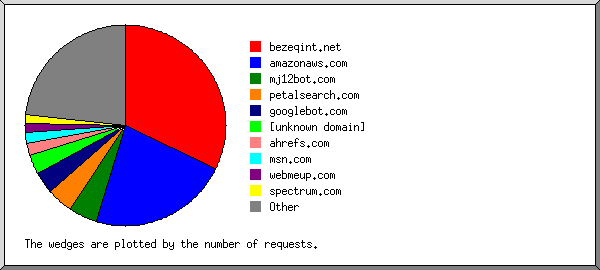
Listing the top 20 organisations by the number of requests, sorted by the number of requests.
reqs: %bytes: organisation
----: ------: ------------
 383:  3.30%: mj12bot.com
 277:  8.01%: 216.73
 235:  7.11%: ahrefs.net
 193:  1.55%: 43
 122:  1.03%: 216.244
  77:  0.66%: semrush.com
  74:  0.61%: [unknown domain]
  74:  0.74%: fbsv.net
  71:  0.31%: googleusercontent.com
  67:  0.54%: googlebot.com
  51:  1.71%: 20
  50:  0.39%: 47
  47:  0.37%: amazonaws.com
  46:  0.36%: 4
  41:  1.38%: 57
  34:  0.28%: petalsearch.com
  26:  0.21%: 124
  25:  0.20%: 49
  23:  0.23%: 101
  22:  0.19%: linodeusercontent.com
 732: 70.81%: [not listed: 189 organisations]
(Go To: Top: General Summary: Monthly Report: Daily Summary: Hourly Summary: Domain Report: Organisation Report: Host Failure Report: Referrer Report: Referring Site Report: Browser Summary: Operating System Report: Status Code Report: File Size Report: File Type Report: Directory Report: Failure Report: Request Report)
This report lists the computers which encountered failed requests.
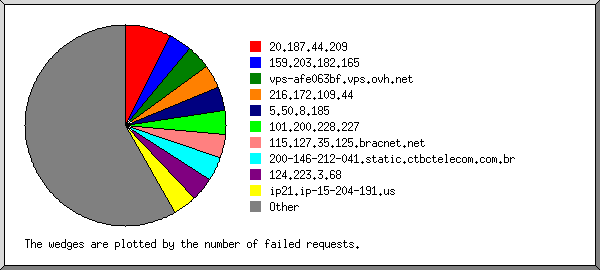
Listing the top 20 hosts by the number of failed requests, sorted by the number of failed requests.
reqs: host
----: ----
1178: 52.178.138.105
 844: 40.113.89.53
 512: 93.152.210.174
 445: 52.169.251.137
 416: 40.113.83.124
 409: 13.69.240.195
 375: 52.178.193.37
 361: 185.177.72.115
 257: 52.178.196.83
 255: 13.74.58.100
 220: 13.74.159.12
 171: 3.160.139.34.bc.googleusercontent.com
 158: 185.177.72.3
 125: r-79-120-142-95.consumer-pool.prcdn.net
  90: 52.126.185.35.bc.googleusercontent.com
  80: hosting.ades.ru
  67: hostglobal.plus
  50: ws01.servername.online
  49: 185.177.72.9
  49: 185.177.72.205
1210: [not listed: 332 hosts]
(Go To: Top: General Summary: Monthly Report: Daily Summary: Hourly Summary: Domain Report: Organisation Report: Host Failure Report: Referrer Report: Referring Site Report: Browser Summary: Operating System Report: Status Code Report: File Size Report: File Type Report: Directory Report: Failure Report: Request Report)
This report lists the referrers (where people followed links from, or pages which included this site's images).
Listing referring URLs with at least 20 requests, sorted by the number of requests.
reqs: URL
----: ---
  89: http://maxhorn.com/
  50: http://www.maxhorn.com/
  33: [not listed: 18 URLs]
(Go To: Top: General Summary: Monthly Report: Daily Summary: Hourly Summary: Domain Report: Organisation Report: Host Failure Report: Referrer Report: Referring Site Report: Browser Summary: Operating System Report: Status Code Report: File Size Report: File Type Report: Directory Report: Failure Report: Request Report)
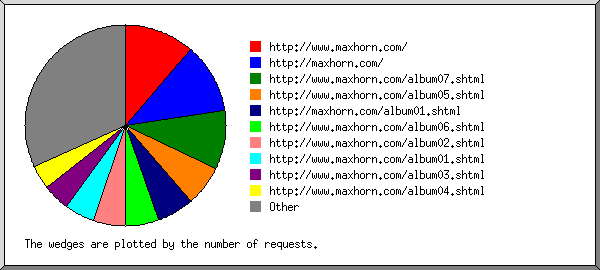
This report lists which servers people followed links from.
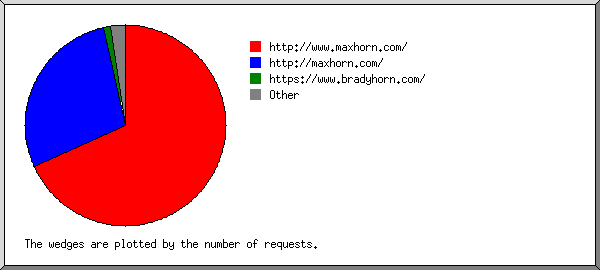
Listing referring sites, sorted by the number of requests.
reqs: site
----: ----
  89: http://maxhorn.com/
  50: http://www.maxhorn.com/
  12: https://bradyhorn.com/
   6: https://www.google.com/
   3: https://www.bradyhorn.com/
   3: http://zacharyahorn.com/
   1: https://www.google.ru/
   1: https://www.google.com.sg/
   1: https://www.google.fr/
   1: https://www.netcraft.com/
   1: http://www.zacharyahorn.com/
   1: https://google.com/
   1: https://www.google.co.uk/
   1: https://www.google.ca/
   1: http://qwk.labguamec.online/
(Go To: Top: General Summary: Monthly Report: Daily Summary: Hourly Summary: Domain Report: Organisation Report: Host Failure Report: Referrer Report: Referring Site Report: Browser Summary: Operating System Report: Status Code Report: File Size Report: File Type Report: Directory Report: Failure Report: Request Report)
This report lists the vendors of visitors' browsers.
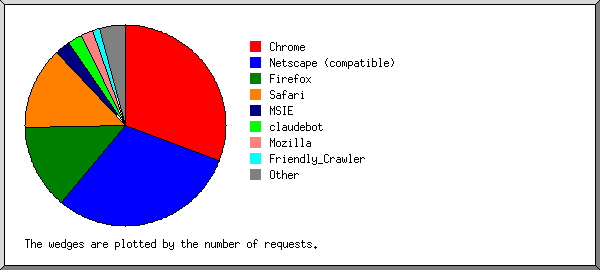
Listing the top 20 browsers by the number of requests, sorted by the number of requests.
reqs: browser
----: -------
1325: Netscape (compatible)
 565: Safari
 510:   Safari/604
  42:   Safari/537
  12:   Safari/605
   1:   Safari/614
 505: Chrome
  72:   Chrome/74
  55:   Chrome/50
  55:   Chrome/114
  30:   Chrome/137
  30:   Chrome/78
  14:   Chrome/81
  27:   Chrome/119
   8:   Chrome/129
   7:   Chrome/91
   7:   Chrome/131
   6:   Chrome/60
  13:   Chrome/130
   5:   Chrome/66
   5:   Chrome/80
  35:   Chrome/121
   7:   Chrome/48
   5:   Chrome/120
  31:   Chrome/122
  11:   Chrome/116
   6:   Chrome/17
  74: facebookexternalhit
  74:   facebookexternalhit/1
  53: Firefox
   7:   Firefox/137
   5:   Firefox/126
   4:   Firefox/3
   4:   Firefox/115
  23:   Firefox/123
   1:   Firefox/35
   1:   Firefox/121
   1:   Firefox/104
   1:   Firefox/140
   1:   Firefox/127
   1:   Firefox/128
   1:   Firefox/2
   1:   Firefox/118
   1:   Firefox/136
   1:   Firefox/125
  41: meta-externalagent
  41:   meta-externalagent/1
  22: PycURL
  22:   PycURL/7
  10: Mozilla
   8: Expanse, a Palo Alto Networks company, searches across the global IPv4 space multiple times per day to identify customers' presences on the Internet. If you would like to be excluded from our scans, please send IP addresses
   8:   Expanse, a Palo Alto Networks company, searches across the global IPv4 space multiple times per day to identify customers' presences on the Internet. If you would like to be excluded from our scans, please send IP addresses/domains
   7: python-requests
   7:   python-requests/2
   5: CCBot
   5:   CCBot/2
   4: Python
   4:   Python/3
   4: Go-http-client
   4:   Go-http-client/1
   4: CheckMarkNetwork
   4:   CheckMarkNetwork/1
   3: 2ip bot
   3:   2ip bot/1
   3: Dalvik
   3:   Dalvik/2
   2: Hello from Palo Alto Networks, find out more about our scans in https:
   2:   Hello from Palo Alto Networks, find out more about our scans in https://docs-cortex
   2: Baiduspider
   2:   Baiduspider/2
   2: panscient.com
   2: curl
   2:   curl/7
   3: [not listed: 2 browsers]
(Go To: Top: General Summary: Monthly Report: Daily Summary: Hourly Summary: Domain Report: Organisation Report: Host Failure Report: Referrer Report: Referring Site Report: Browser Summary: Operating System Report: Status Code Report: File Size Report: File Type Report: Directory Report: Failure Report: Request Report)
This report lists the operating systems used by visitors.
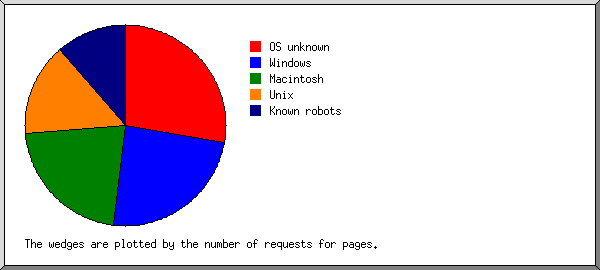
Listing operating systems, sorted by the number of requests for pages.
no.: reqs: pages: OS
---: ----: -----: --
  1:  557:   516: Macintosh
  2: 1229:   311: OS unknown
  3:  337:   269: Windows
   :  282:   217:   Windows NT
   :   49:    47:   Windows 7
   :    5:     4:   Unknown Windows
   :    1:     1:   Windows Vista
  4:  156:   131: Unix
   :  154:   130:   Linux
   :    2:     1:   Other Unix
  5:  365:   114: Known robots
(Go To: Top: General Summary: Monthly Report: Daily Summary: Hourly Summary: Domain Report: Organisation Report: Host Failure Report: Referrer Report: Referring Site Report: Browser Summary: Operating System Report: Status Code Report: File Size Report: File Type Report: Directory Report: Failure Report: Request Report)
This report lists the HTTP status codes of all requests.

Listing status codes, sorted numerically.
reqs: status code
----: -----------
2584: 200 OK
  75: 206 Partial content
  11: 304 Not modified since last retrieval
 402: 403 Access forbidden
6919: 404 Document not found
(Go To: Top: General Summary: Monthly Report: Daily Summary: Hourly Summary: Domain Report: Organisation Report: Host Failure Report: Referrer Report: Referring Site Report: Browser Summary: Operating System Report: Status Code Report: File Size Report: File Type Report: Directory Report: Failure Report: Request Report)
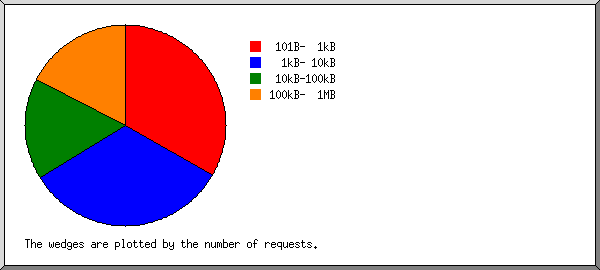
This report lists the sizes of files.
       size: reqs: %bytes:
-----------: ----: ------:
          0:    0:       :
   1B-  10B:    0:       :
  11B- 100B:    0:       :
 101B-  1kB: 2230: 18.27%:
  1kB- 10kB:  327: 16.52%:
 10kB-100kB:  113: 65.21%:
(Go To: Top: General Summary: Monthly Report: Daily Summary: Hourly Summary: Domain Report: Organisation Report: Host Failure Report: Referrer Report: Referring Site Report: Browser Summary: Operating System Report: Status Code Report: File Size Report: File Type Report: Directory Report: Failure Report: Request Report)
This report lists the extensions of files.
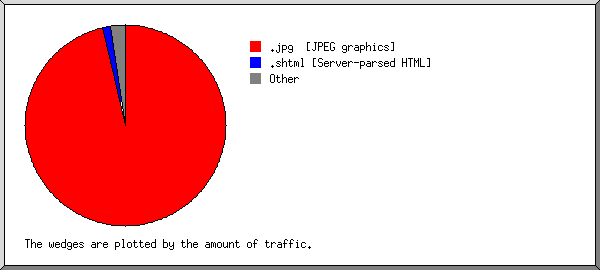
Listing extensions with at least 0.1% of the traffic, sorted by the amount of traffic.
reqs: %bytes: extension
----: ------: ---------
 104: 60.05%: .jpg  [JPEG graphics]
 327: 16.52%: .xml
1345: 14.18%: [directories]
 873:  7.47%: .txt  [Plain text]
   3:  1.68%: .JPG
  18:  0.10%: [not listed: 2 extensions]
(Go To: Top: General Summary: Monthly Report: Daily Summary: Hourly Summary: Domain Report: Organisation Report: Host Failure Report: Referrer Report: Referring Site Report: Browser Summary: Operating System Report: Status Code Report: File Size Report: File Type Report: Directory Report: Failure Report: Request Report)
This report lists the directories from which files were requested. (The figures for each directory include all of its subdirectories.)

Listing directories with at least 0.01% of the traffic, sorted by the amount of traffic.
reqs: %bytes: directory
----: ------: ---------
 113: 65.21%: /images/
2557: 34.79%: [root directory]
(Go To: Top: General Summary: Monthly Report: Daily Summary: Hourly Summary: Domain Report: Organisation Report: Host Failure Report: Referrer Report: Referring Site Report: Browser Summary: Operating System Report: Status Code Report: File Size Report: File Type Report: Directory Report: Failure Report: Request Report)
This report lists the files that caused failures, for example files not found.
Listing the top 30 files by the number of failed requests, sorted by the number of failed requests.
reqs: file
----: ----
  72: /new
  72: /wp
  72: /old
  72: /wordpress
  72: /main
  70: /bc
  70: /bk
  70: /backup
  69: /home
  41: /djmax_files/
  40: /index.shtml
  33: /favicon.ico
  32: /album10.shtml
  31: /album02.shtml
  31: /album03.shtml
  29: /album04.shtml
  28: /album09.shtml
  27: /djmax.htm
  27: /homepage.html
  26: /album08.shtml
  25: /album01.shtml
  21: /album07.shtml
  21: /album06.shtml
  20: /album05.shtml
  20: /xmlrpc.php
  18: /djmax_files
  16: /.env
  16: /footer.html
  16: /about.php
  16: /wp-includes/ID3/
6148: [not listed: 2,791 files]
(Go To: Top: General Summary: Monthly Report: Daily Summary: Hourly Summary: Domain Report: Organisation Report: Host Failure Report: Referrer Report: Referring Site Report: Browser Summary: Operating System Report: Status Code Report: File Size Report: File Type Report: Directory Report: Failure Report: Request Report)
This report lists the files on the site.
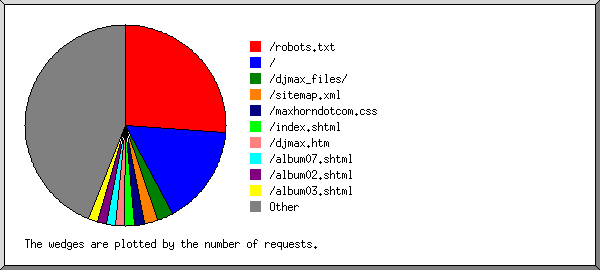
Listing files with at least 20 requests, sorted by the number of requests.
reqs: %bytes:       last time: file
----: ------: ---------------: ----
1339: 10.70%: 17/Jul/25 23:39: /
 873:  7.47%: 17/Jul/25 23:54: /robots.txt
 327: 16.52%: 17/Jul/25 23:16: /sitemap.xml
 131: 65.31%: 17/Jul/25 16:23: [not listed: 98 files]
(Go To: Top: General Summary: Monthly Report: Daily Summary: Hourly Summary: Domain Report: Organisation Report: Host Failure Report: Referrer Report: Referring Site Report: Browser Summary: Operating System Report: Status Code Report: File Size Report: File Type Report: Directory Report: Failure Report: Request Report)

